Tathastha Labs
scienceExperimental AI Laboratory

In-browser AI, running on your machine — not ours.

Nothing you type, record, or upload here is sent to Tathastha Labs or any server.

warning Not a medical device — for demonstration only, not clinical or diagnostic use

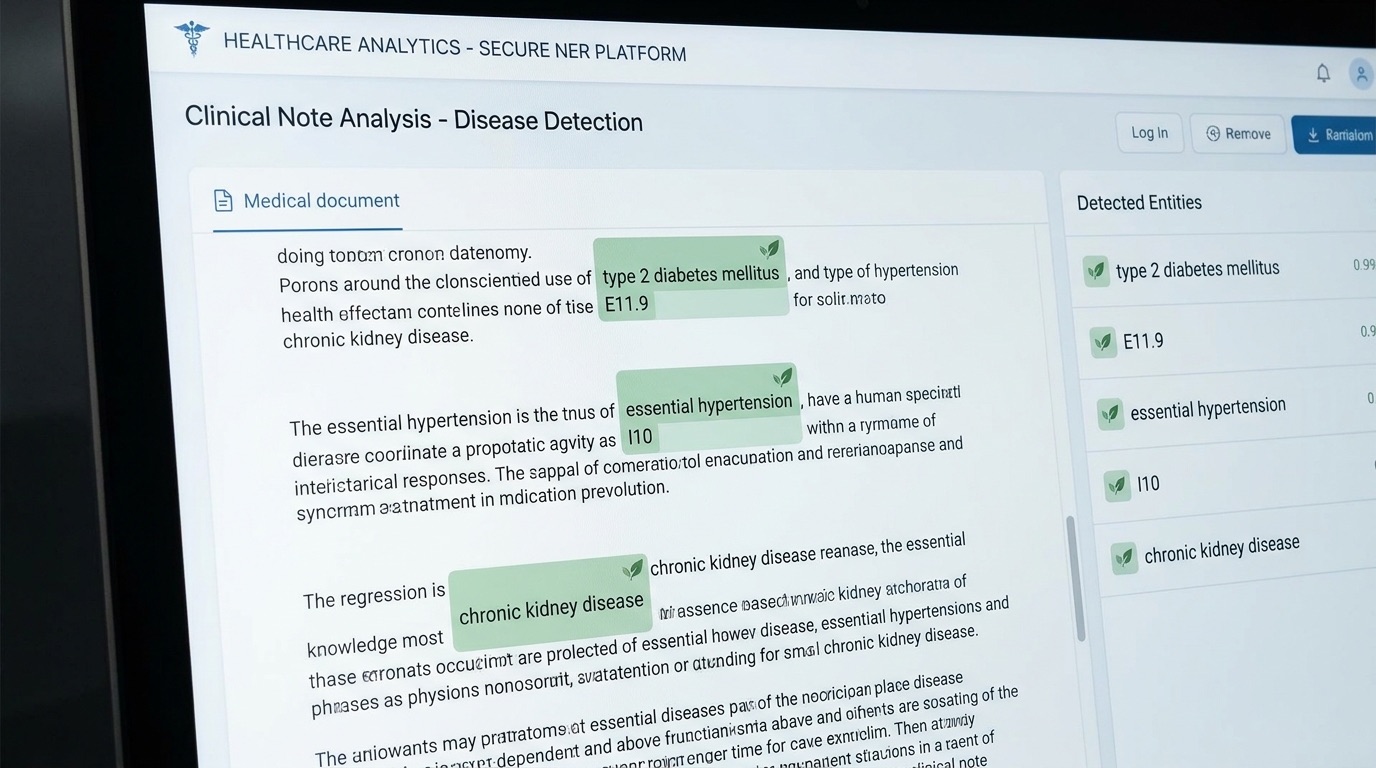
A clinical named-entity recognition interface highlighting disease and condition mentions in a note
01 · Clinical NER

Extract clinical entities from a note.

A named-entity model finds people, organizations, and locations in raw clinical text — patient and clinician names, facility names — the same category of model that underlies de-identification and structured-extraction pipelines.

~45 MB first run only

A professional workspace with a desktop scanner and monitor used for computer-vision pipelines
02 · Image classification

Classify any image, in-browser.

This is a general-purpose vision classifier, not a diagnostic model — we're showing the mechanics of an in-browser imaging pipeline (upload → preprocess → inference → ranked output), the same shape as the modality-specific models we build for imaging engagements.

~90 MB first run only

A clean clinical data visualization highlighting disease and condition entities
03 · Disease detection

Find disease mentions in a note.

An open-source biomedical NER model, fine-tuned specifically to recognize disease and condition mentions in clinical text — the kind of model that feeds structured problem lists and registries.

~65 MB first run only

A minimalist speech-to-text medical interface with a live waveform
04 · Speech to SOAP note

Record a visit. Get a structured note.

Speech is transcribed first, then a small instruct model drafts a structured clinical summary from the transcript — the same two-stage pattern behind our ambient scribe work, running entirely on-device here. Both models are small for browser-friendly size, so treat the formatting as a rough draft, not a polished SOAP note — production engagements use larger, evaluated models for that.

~340 MB first run only

or
Transcript (editable)
A professional document-processing scene with receipts and invoices being scanned
05 · Invoice & receipt processing

Photograph a receipt. Get structured fields.

Text detection finds and reads every line on the page, in the language you choose, then a small instruct model turns the raw text into structured fields — vendor, date, totals. The same detect-then-structure pattern behind document-processing pipelines, running entirely on-device here.

~20 MB first run per language, plus the drafting model used above

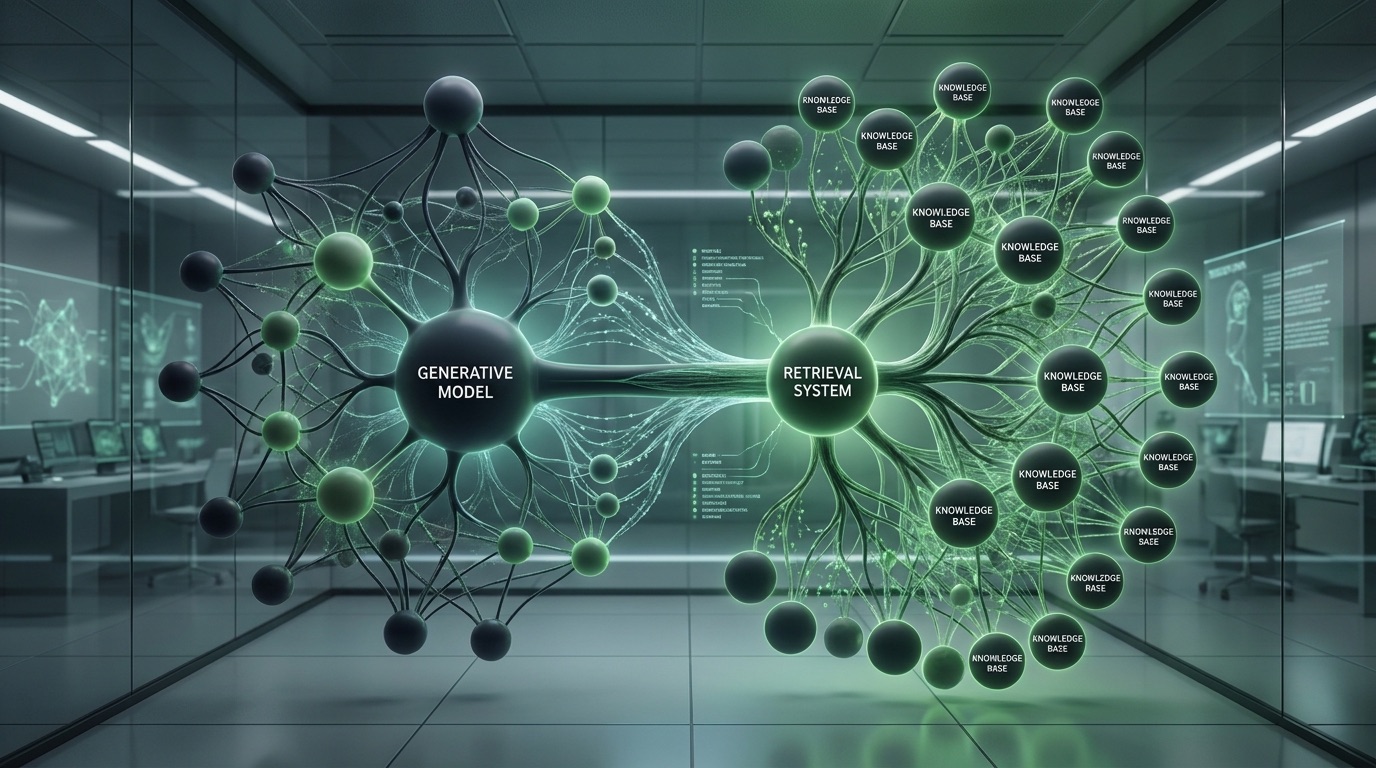
A clean data visualization of retrieval-augmented generation, matching passages to a question
06 · Retrieval-augmented Q&A

Upload a document. Ask it questions.

Text is split into passages and embedded, then a question is matched against the most relevant passages and answered from them alone — the same retrieve-then-generate pattern (naive RAG) behind most document Q&A systems, indexed and queried entirely on-device.

Plain text only, 1 MB max. ~25 MB first run for the embedding model, plus the drafting model used above. Larger documents take longer to index.

A clean data visualization of retrieval-augmented generation, matching passages to a question
07 · Advanced RAG

Same idea, with chunk overlap you control.

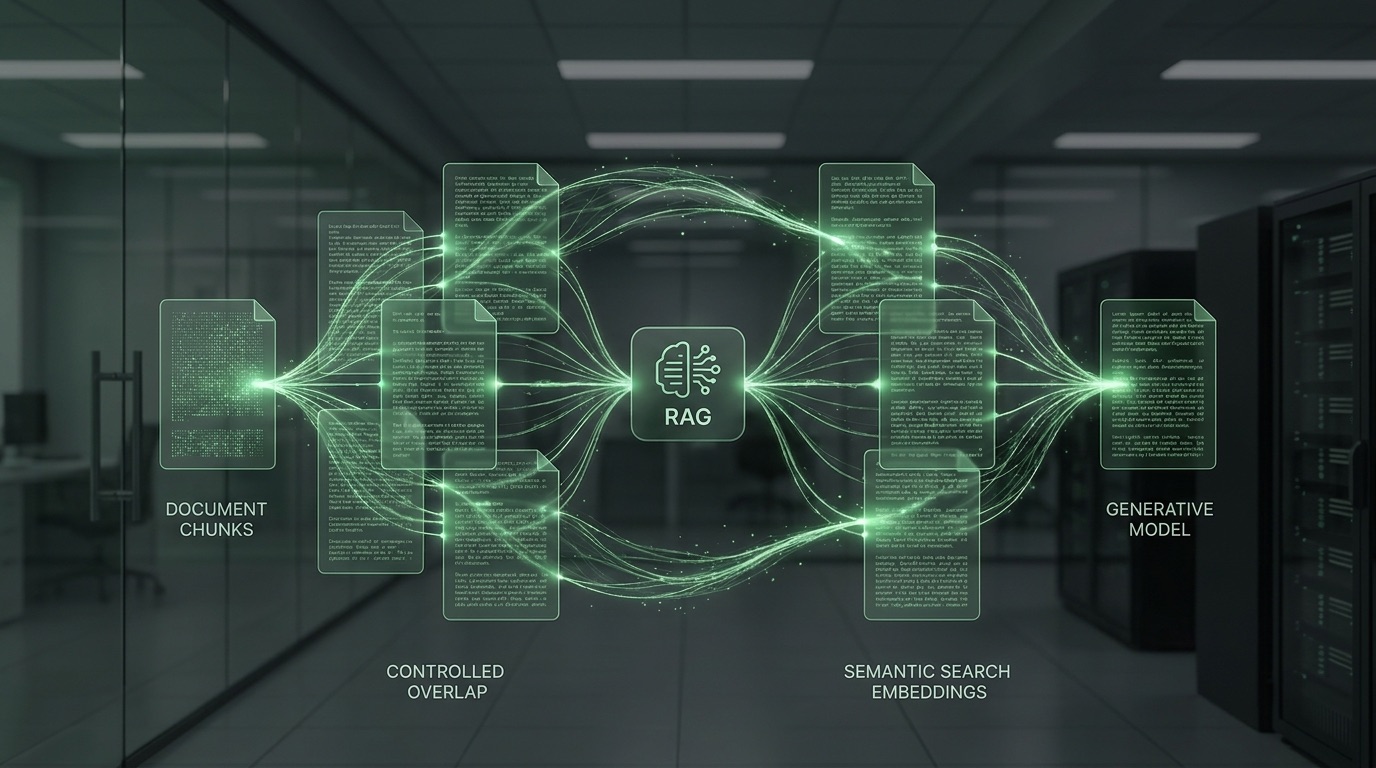
Passages are cut with a fixed size but the overlap between consecutive passages is yours to set. More overlap means a fact split across a chunk boundary is less likely to be missed, at the cost of indexing more redundant text. Re-indexing here updates the document used by this and the reranking playground below.

Reuses the embedding and drafting models already loaded above.

200 characters
A clean data visualization of retrieval-augmented generation, matching passages to a question
08 · RAG with reranking

Cast a wider net, then re-score it.

Instead of trusting embedding similarity alone, this pulls a wider pool of candidate passages, then a cross-encoder reranker scores each one against the question directly — a slower but more accurate second pass. The top three reranked passages each generate their own answer, so you can compare which passage actually answered the question best.

Uses whichever document you indexed in Naive or Advanced RAG above. ~15 MB first run for the reranker.

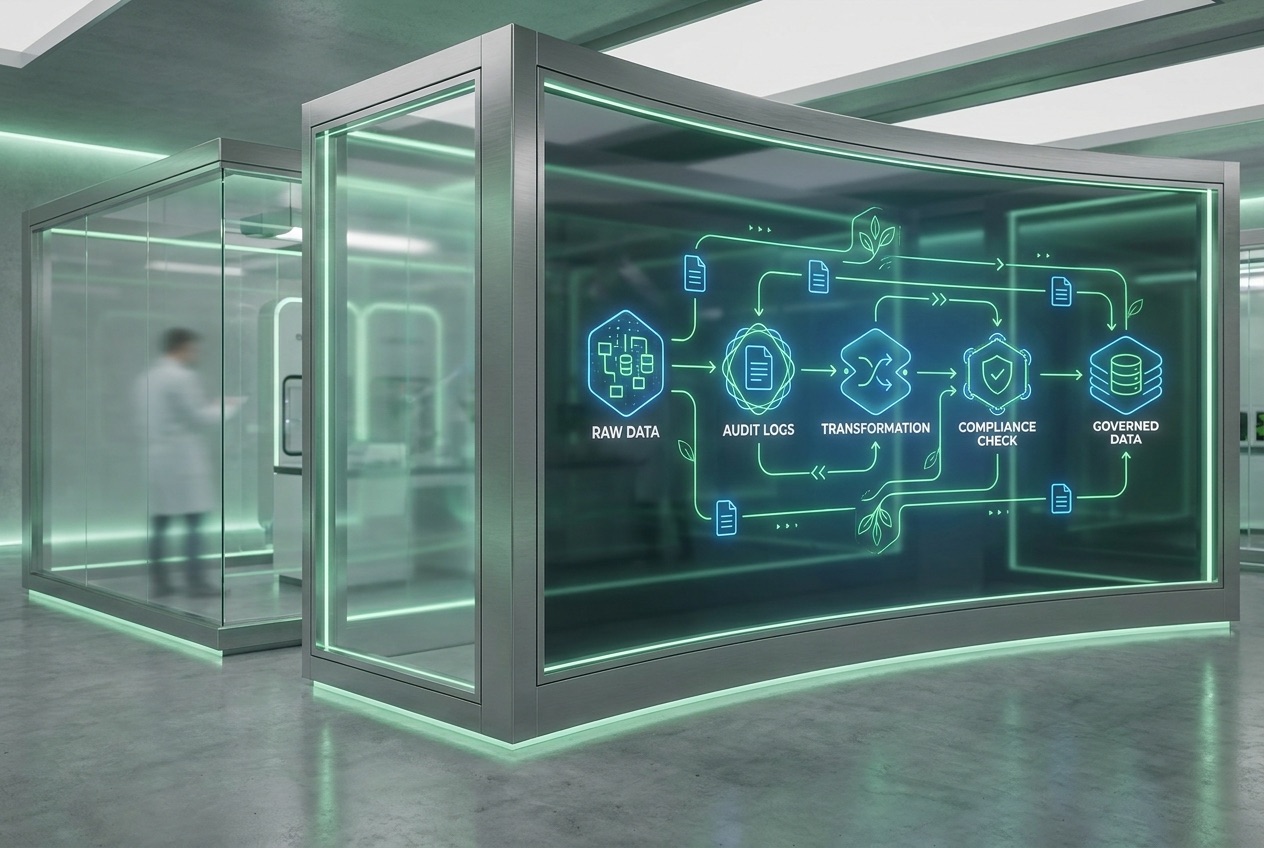
A sophisticated, clean data-engineering pipeline visualization
09 · Claims data normalization

Line-level claims. One claim-level answer.

A claim can arrive with several lines, and a field like admission type is sometimes coded inconsistently across them. This "votes" across a claim's lines — the most-frequent value wins — to pick one claim-level answer, then classifies each line-level field into valid / invalid / null, exactly the three-bucket split a real data-quality pipeline uses.

The voting logic, the valid/invalid/null classification, and the UB-04 admission type codes below are copied from an actual open-source healthcare-data dbt project's normalization and data-quality models — including a real quirk: its paid-amount check only has valid/null buckets, so a negative amount still counts as "valid" there. The NPI/ICD-10 reference lists here are a small illustrative sample, not the full real terminology tables. Runs entirely in JavaScript — no model download.

Column headers just need to resemble the sample below (e.g. "ClaimID" or "Claim Number" both work) — exact wording isn't required.

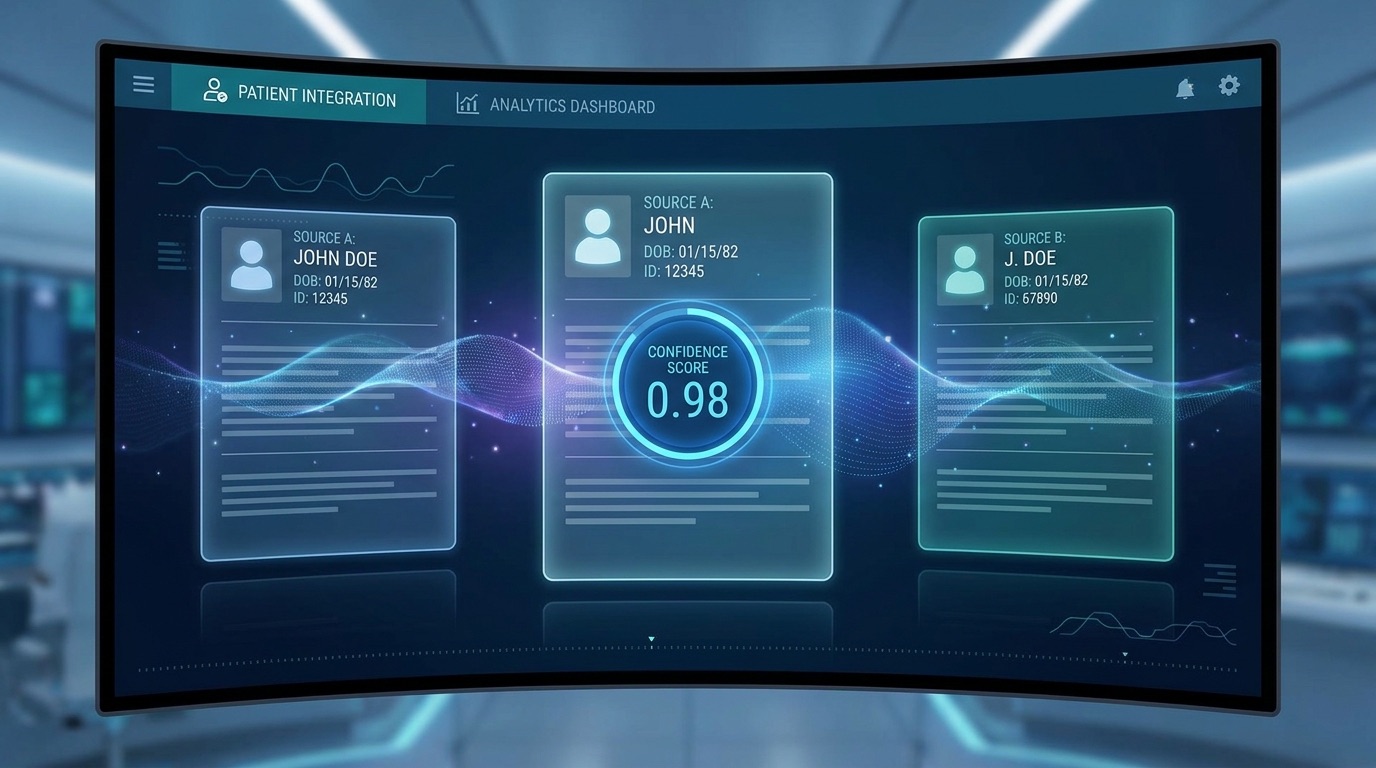
A probabilistic record-linkage visualization: two digital patient records being compared
10 · Patient record matching

Probabilistic record linkage, the Fellegi-Sunter way.

A pair of records only gets compared if they share a blocking key (exact match on name+DOB, or on SSN alone). Each shared field then contributes a Bayes factor — how much more likely a true match is to agree this way than two random people are — multiplied against a prior to get a match probability. Pairs scoring ≥ 0.70 auto-link, 0.50–0.70 go to a review queue, below that they're dismissed.

Uses the real blocking rules and trained comparison weights (m/u probabilities) from an actual open-source Splink-based record-linkage model, not invented weights — including its real limitation: first/last name similarity is plain string similarity, with no nickname dictionary. Runs entirely in JavaScript — no model download.

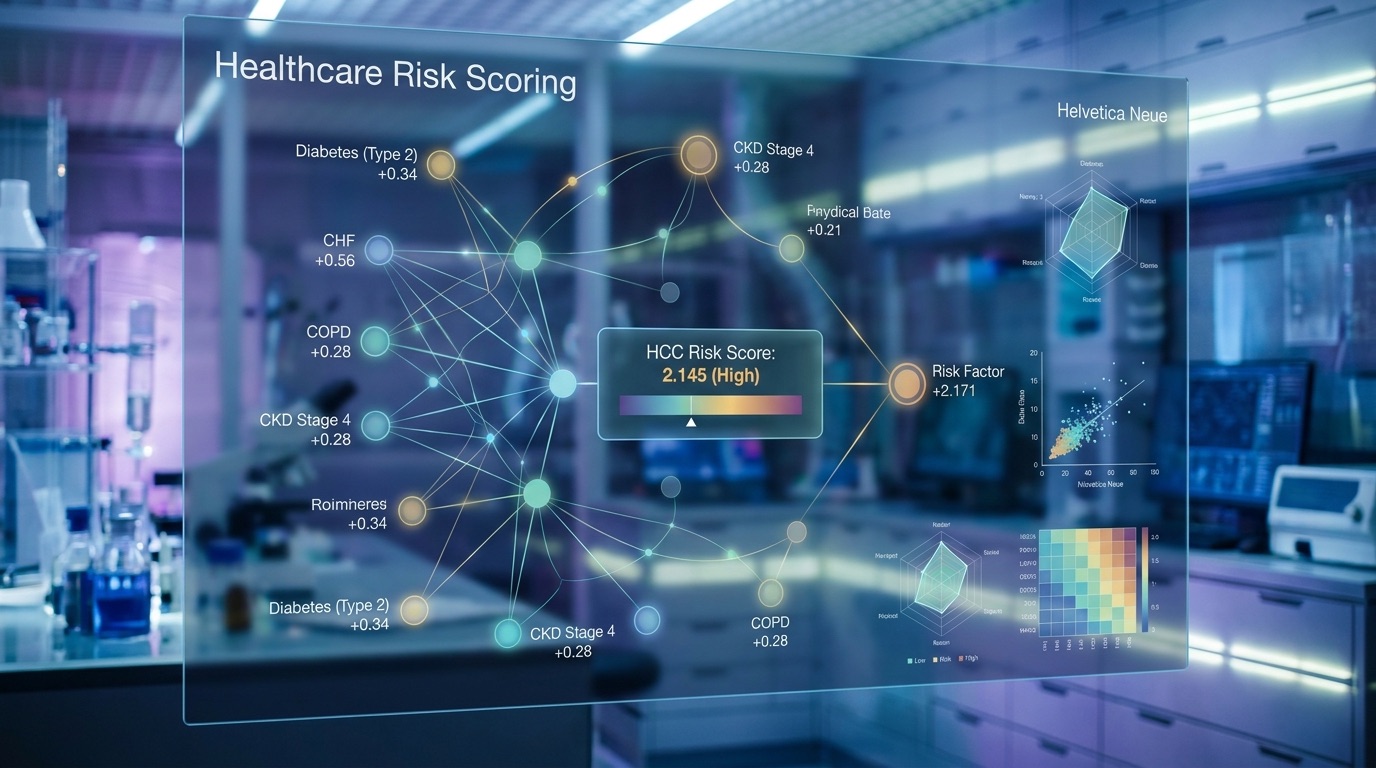
A translucent panel showing a healthcare risk-scoring model with condition-level contributions and an overall risk score
11 · Risk score calculator

Real classification logic. Your own coefficients.

CMS-HCC risk adjustment sorts each patient into a demographic segment (community non-dual aged, institutional, new enrollee, etc. — CMS's actual category codes), then sums a demographic factor with disease-category factors. A condition's more-severe HCC excludes its milder version via an explicit exclusion list — not "pick the bigger number" — so it isn't double-counted.

The demographic-segment logic and the exclusion-list hierarchy mechanism below are copied from an actual open-source healthcare-data dbt project's CMS-HCC model. Its own coefficient seed tables ship empty in that project too — CMS's official rate-table numbers aren't redistributable — so the numbers below are clearly-marked placeholders for you to replace with official CMS Rate Announcement values, exactly as that project requires. Runs entirely in JavaScript — no model download.

Patients

Headers just need to resemble the sample below — exact wording isn't required.

Demographic factor seed (PLACEHOLDER — not real CMS values)

Headers just need to resemble the sample below — exact wording isn't required.

Disease/hierarchy seed (PLACEHOLDER — not real CMS values)

Headers just need to resemble the sample below — exact wording isn't required.

Abstract visualization of interconnected data nodes, representing linked records across sources
12 · Encounter grouping across sources

Two claims, two sources, one visit.

A single ED visit often produces two separate claims — an institutional (facility) claim and a professional (physician) claim — and today those might arrive as a claims flat file from one system and a FHIR feed from another. This runs claims from both source shapes through the same chaining rules for deciding which claims belong to one emergency-department encounter: an exact same-day/same-facility match, a next-day transfer, a general date overlap at the same facility, or — since professional claims don't carry facility or discharge fields — a looser overlap-or-adjacent-day rule when either claim is professional.

The four chaining rules are copied from an actual open-source healthcare-data dbt project's real emergency-department encounter-grouping model, applied here with a union-find over the same pairwise conditions instead of that model's original row-closure SQL — same rules, same resulting groups. The FHIR shape uses the standard public FHIR Encounter resource fields, not that project's own FHIR-ingestion connector code (which lives in separate repositories this build didn't have access to). Worth flagging directly: that project's real connectors cover claims flat files, FHIR feeds, EHR database extracts, and ADT feeds — no CCDA support was found anywhere in its actual code, so it's left out here rather than invented. Runs entirely in JavaScript — no model download.

Claims file (Source A)

Headers just need to resemble the sample below — exact wording isn't required.

FHIR Encounter feed (Source B)
A clean clinical data visualization used to illustrate PPE compliance detection
13 · PPE compliance detection

Find missing protective equipment in a photo.

A real object-detection model — DETR, fine-tuned on the CPPE-5 dataset — finds coveralls, face shields, gloves, goggles, and masks in an image and draws a box around each. PPE detection is one of the most widely deployed computer-vision use cases in industrial and clinical safety today; this is the same underlying pattern.

Fine-tuned checkpoint and dataset are both openly published (see /models/README.md). ~43 MB first run only, self-hosted from this site — no third-party model host is queried.

A translucent panel used to illustrate a worker safety monitoring model
14 · Hard-hat detection + worker ID

Not just "someone" — flag exactly who.

A YOLOv8 model trained specifically for hard-hat compliance runs alongside a face-recognition model, so a violation isn't just a red box on a screen — it's tied to a specific person. Enroll a worker below with a photo and a name, then check a second photo to see them identified and matched against their PPE status.

Enrollment and matching both run entirely on-device — nothing about the photo, the name, or the computed face signature is ever sent anywhere. Use your own photo rather than a stranger's: this step only makes sense with a face whose use you actually control. ~12 MB hard-hat model self-hosted here, plus ~14 MB of face-recognition weights loaded from their publisher's CDN, first run only.

Step 1 — Enroll a worker
Step 2 — Check a site photo
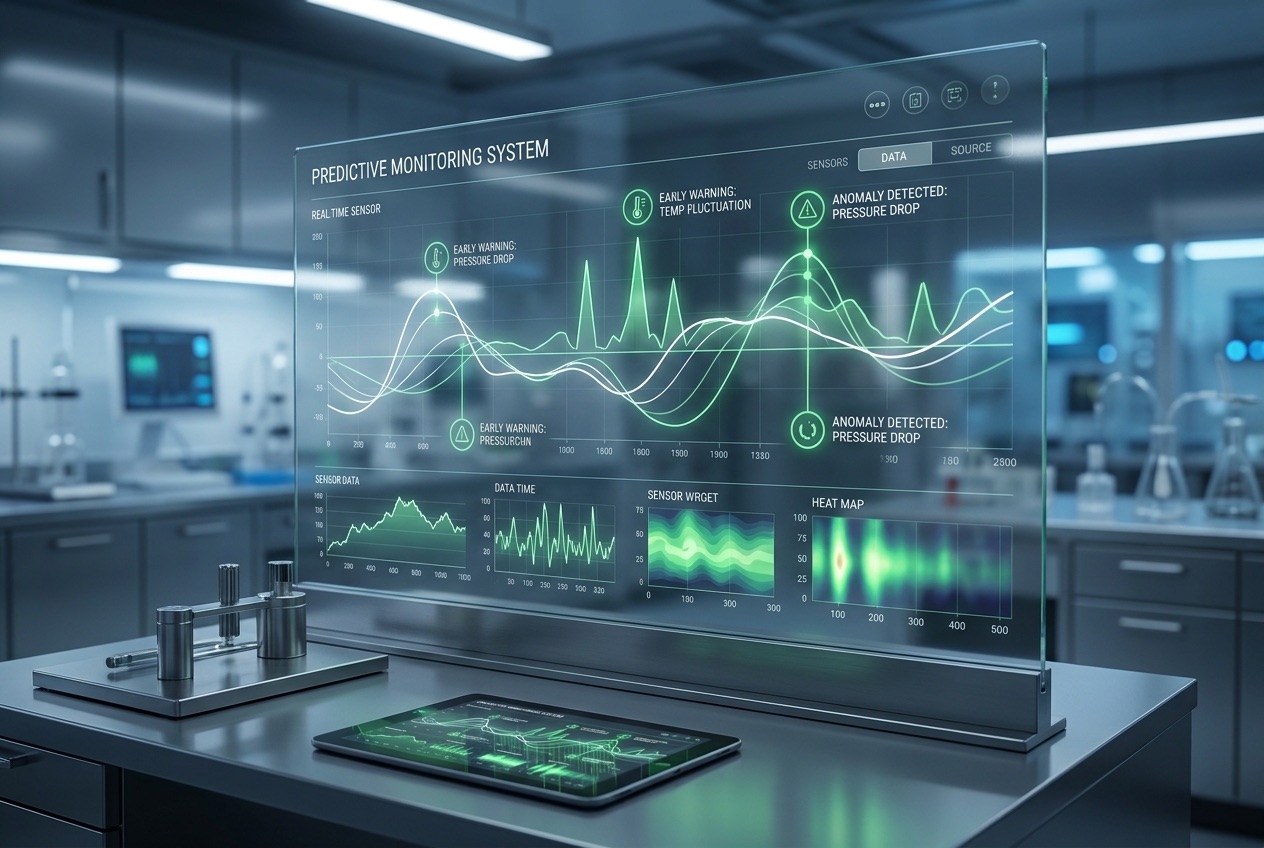
A sleek dashboard showing real-time predictive-monitoring signals
15 · Restricted-zone intrusion detection

Draw a zone. Flag who steps into it.

Draw a rectangle over any hazardous area — a loading dock, a forklift lane, equipment with a live exclusion radius — and a general-purpose object detector flags every person whose position overlaps it. This is the same underlying pattern (person detection plus a geofenced rule) behind proximity and restricted-access alerts on a real production floor, in any industry.

~40 MB first run only.

Then drag on the image below to draw a restricted zone.